New in v11
otutab_octave command
See also
OTU table
OTU commands
Octave plot
Interpreting octave plots
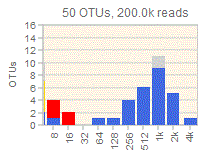
 Generates an octave plot
from an OTU table which must be in QIIME classic format.
By default, OTUs which may be spurious due to
cross-talk are indicated by coloring.
Cross-talk colors are determined by the
UNCROSS2 score. This feature can be turned off by specifying the -noxtalk
option.
If a distance matrix is
provided for the OTUs, then low-abundance OTUs which may be spurious due to
a very similar dominant OTU are indicated by
coloring. The distance matrix can be generated from the OTU sequence FASTA
file using the calc_distmx command.
A second OTU table can be specified by the
-otutab_with_singles option. This table should be generated using the same
procedure as the first OTU table, except that singleton unique sequences
should be retained and for the first table they should be discarded.
This means that the first table (singletons discarded, otutab_octave option)
gives a lower bound on the number of OTUs in each bin, and the second table
(singletons included, otutab_with_singles option) gives an upper bound. The
true diversity must therefore lie somewhere between the two. The excess
diversity obtained with singletons included is indicated by light gray
coloring.
Output can be written to a web page (HTML file) using the
-htmlout option and/or an
SVG format
vector graphics file using the -svgout option. The SVG file can be edited
for publication using a
vector
graphics editor such as Inkscape.
Example octave plots
Yow 2017 study with cross-talk and noise (see
octave plot page for reference)
Yow 2017 study without cross-talk or noise
Example
usearch -otutab_octave otutab.txt -distmxin distmx.txt \
-otutab_with_singles otutab_singles.txt \
-htmlout octave.html -svgout
octave.svg
Reference (please cite)
R.C. Edgar and H. Flyvbjerg (2018), Octave plots for visualizing diversity of microbial OTUs, https://doi.org/10.1101/389833
• Octave plots visualize alpha diversity as a histogram
• Plots show shape and completeness of distribution


